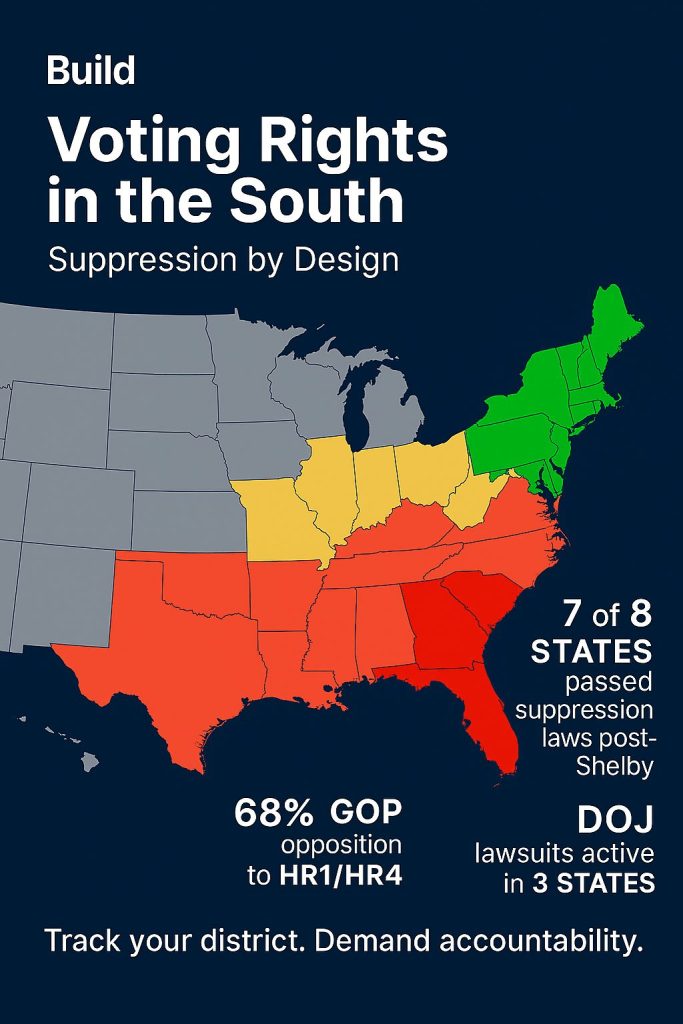
Tracking the fight for voting rights across Alabama, Georgia, Florida, Mississippi, South Carolina, and Texas
🕒 Last updated: October 11, 2025
| Member Name | Chamber | State | Party | Voting Rights Score | Key Votes | Sponsored Bills | Suppression Risk | District/State | Profile Link | |
|---|---|---|---|---|---|---|---|---|---|---|
| ------------- | --------- | ------- | ------- | --------------------- | ----------- | ------------------ | ------------------ | ---------------- | -------------- | |
| Terri Sewell | House | AL | D | 96% | ✅ HR1, ✅ HR4 | 3 voting rights bills | High | AL-7 | View Profile | |
| Bennie Thompson | House | MS | D | 94% | ✅ HR1, ✅ HR4 | 2 voting rights bills | High | MS-2 | View Profile | |
| Nikema Williams | House | GA | D | 94% | ✅ HR1, ✅ HR4 | 2 voting rights bills | High | GA-5 | View Profile | |
| Raphael Warnock | Senate | GA | D | 98% | ✅ HR1, ✅ HR4 | 3 voting rights bills | High | Georgia | View Profile | |
| Jon Ossoff | Senate | GA | D | 94% | ✅ HR1, ✅ HR4 | 2 voting rights bills | High | Georgia | View Profile | |
| Frederica Wilson | House | FL | D | 92% | ✅ HR1, ✅ HR4 | 2 voting rights bills | High | FL-24 | View Profile | |
| Maxwell Frost | House | FL | D | 90% | ✅ HR1, ✅ HR4 | 1 voting rights bill | High | FL-10 | View Profile | |
| Jasmine Crockett | House | TX | D | 88% | ✅ HR1, ✅ HR4 | 1 voting rights bill | High | TX-30 | View Profile | |
| Sheila Jackson Lee | House | TX | D | 92% | ✅ HR1, ✅ HR4 | 2 voting rights bills | High | TX-18 | View Profile | |
| Al Green | House | TX | D | 90% | ✅ HR1, ✅ HR4 | 1 voting rights bill | High | TX-9 | View Profile | |
| Jim Clyburn | House | SC | D | 94% | ✅ HR1, ✅ HR4 | 2 voting rights bills | High | SC-6 | View Profile | |
| Kathy Castor | House | FL | D | 90% | ✅ HR1, ✅ HR4 | 1 voting rights bill | High | FL-14 | View Profile | |
| Byron Donalds | House | FL | R | 28% | ❌ HR1, ❌ HR4 | None | High | FL-19 | View Profile | |
| Rick Scott | Senate | FL | R | 16% | ❌ HR1, ❌ HR4 | None | High | Florida | View Profile | |
| Marco Rubio | Senate | FL | R | 18% | ❌ HR1, ❌ HR4 | None | High | Florida | View Profile | |
| Lindsey Graham | Senate | SC | R | 14% | ❌ HR1, ❌ HR4 | None | High | South Carolina | View Profile | |
| Tim Scott | Senate | SC | R | 16% | ❌ HR1, ❌ HR4 | None | High | South Carolina | View Profile | |
| Tommy Tuberville | Senate | AL | R | 14% | ❌ HR1, ❌ HR4 | None | High | Alabama | View Profile | |
| John Cornyn | Senate | TX | R | 12% | ❌ HR1, ❌ HR4 | None | High | Texas | View Profile | |
| Barry Moore | House | AL | R | 24% | ❌ HR1, ❌ HR4 | None | High | AL-1 | View Profile | |
| John McGuire | House | VA | R | 22% | ❌ HR1, ❌ HR4 | None | High | VA-5 | View Profile | |
| Wesley Hunt | House | TX | R | 26% | ❌ HR1, ❌ HR4 | None | High | TX-38 | View Profile | |
| Carlos Giménez | House | FL | R | 28% | ❌ HR1, ❌ HR4 | None | High | FL-28 | View Profile | |
| Darren Soto | House | FL | D | 90% | ✅ HR1, ✅ HR4 | 2 voting rights bills | High | FL-9 | View Profile | |
| Brian Mast | House | FL | R | 20% | ❌ HR1, ❌ HR4 | None | High | FL-21 | View Profile | |
| Greg Steube | House | FL | R | 18% | ❌ HR1, ❌ HR4 | None | High | FL-17 | View Profile |
Regional Highlights
Key stats: % of reps with high suppression risk, top voting rights champions, states with lowest scores
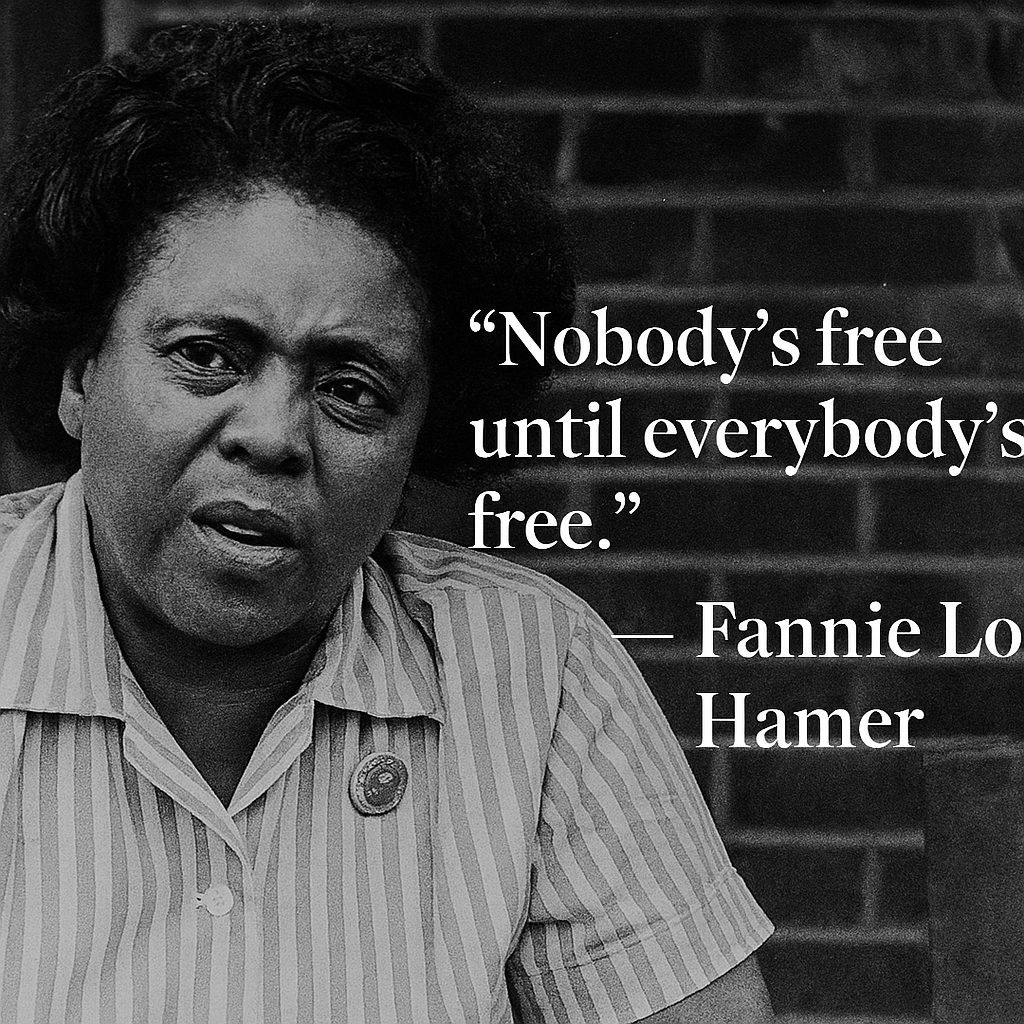
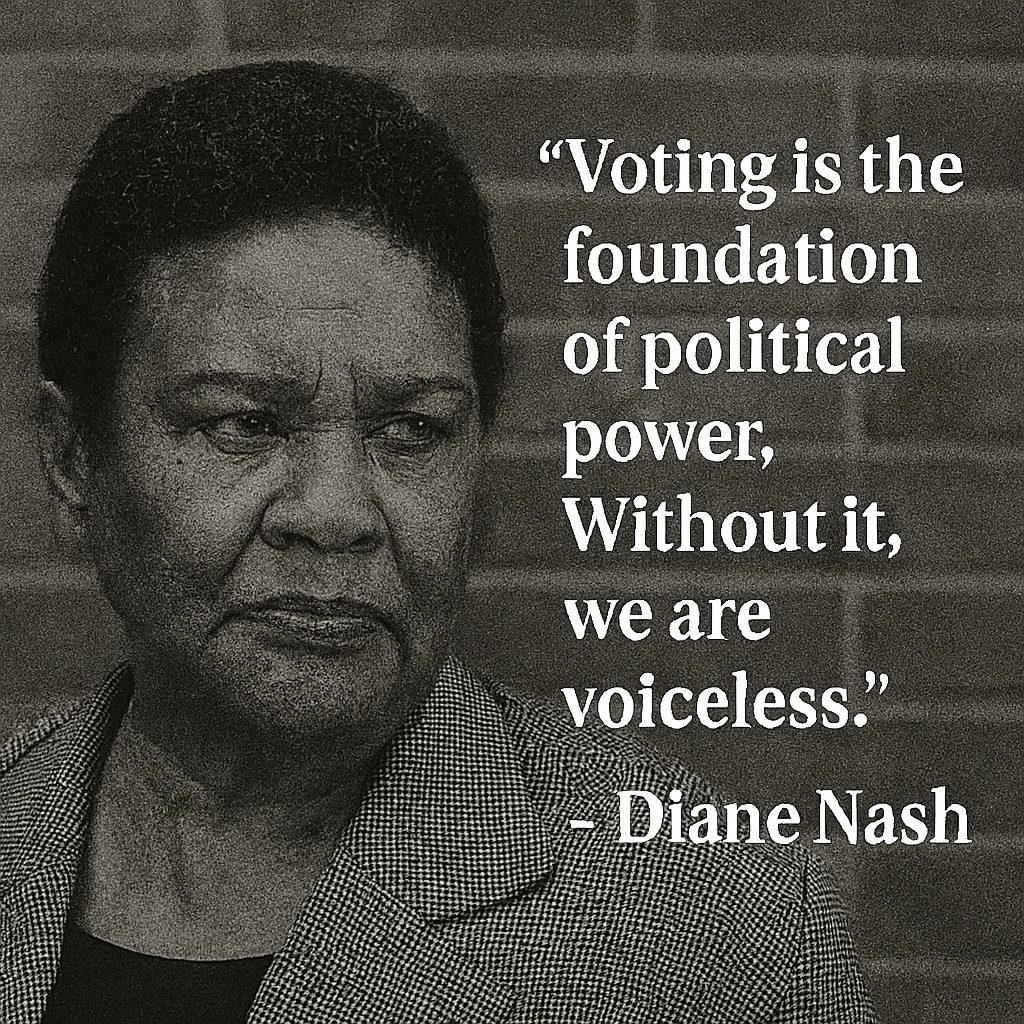
“Nobody’s free until everybody’s free.”
— Fannie Lou Hamer
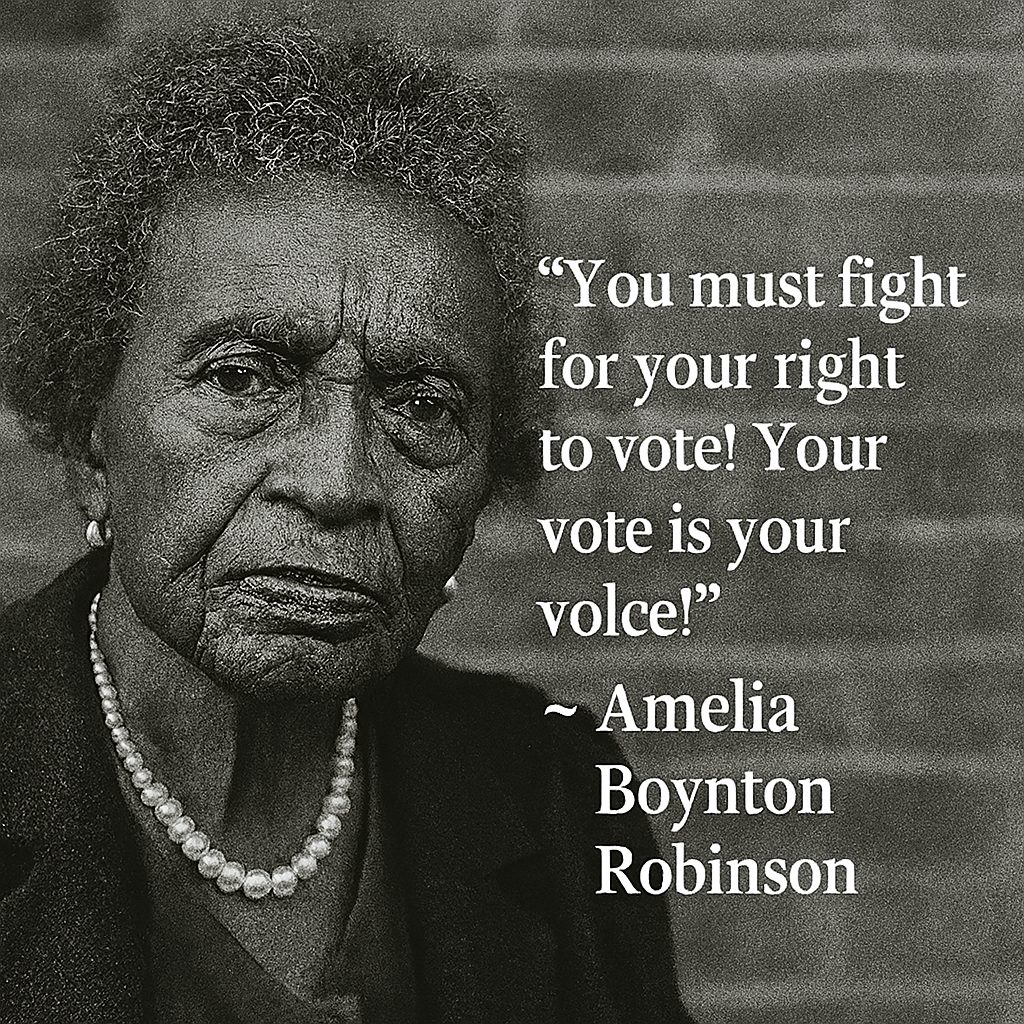
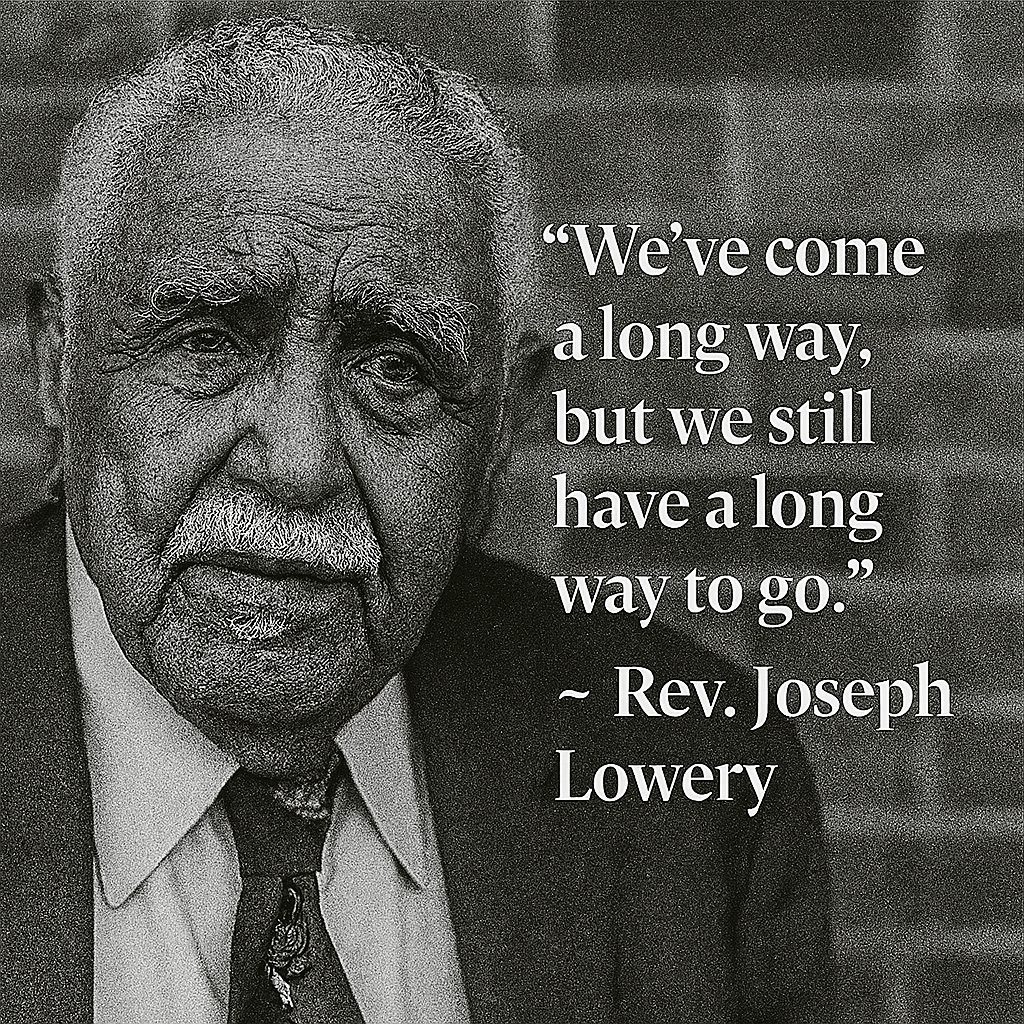

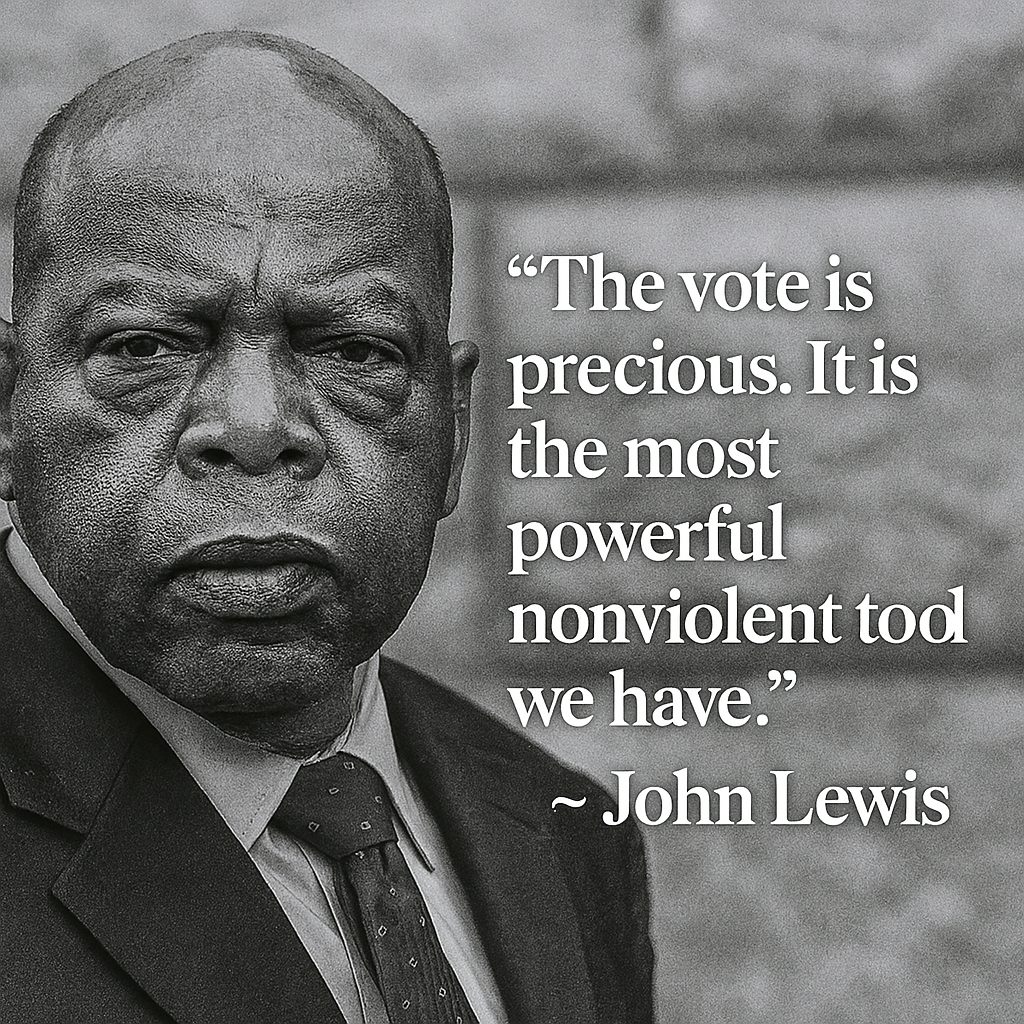
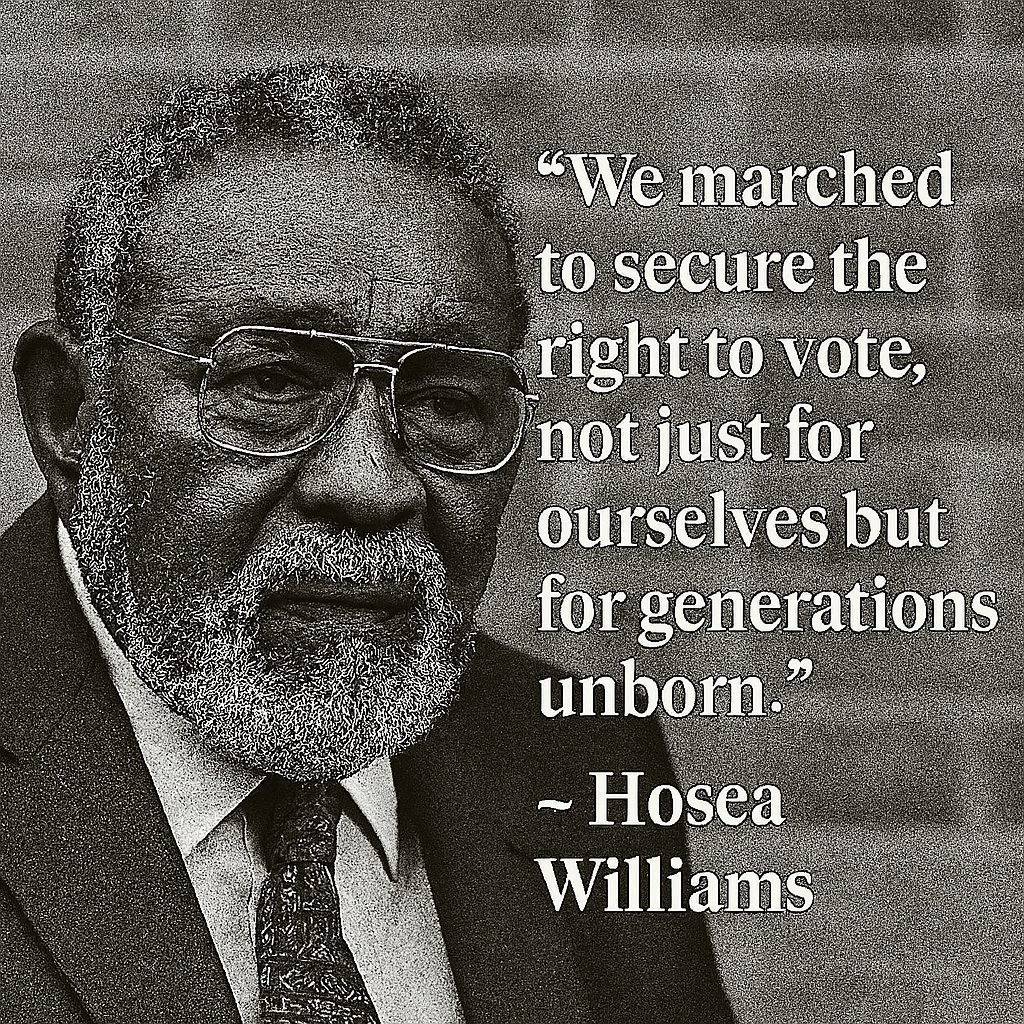
🔹 Legacy & Action Section
🔗 Sources and Further Reading
- Southern Coalition for Social Justice — State of the South: Voting Rights Under Assault
In-depth regional analysis of voter suppression tactics and policy changes affecting the South. - Brennan Center for Justice — State Voting Laws Tracker
Nonpartisan resource tracking state-by-state voting law changes and their impact on access. - Voting Rights Lab — Election Policy Tracker
Monitors voting legislation nationwide, including restrictive and expansive bills in Southern states. - Congressional Black Caucus Foundation — Voting Rights Scorecard
Evaluates state and federal lawmakers’ voting rights positions and legislative sponsorships. - NAACP Legal Defense Fund — Protecting the Vote
Tracks court cases and advocacy efforts defending access to the ballot in the South. - Fordham Democracy Project — New Horizons for State Voting Rights Acts
Policy analysis of state-level Voting Rights Acts, including efforts in Georgia, Alabama, and Florida. - Stateline — States Move to Replace Federal Voting Rights Protections
Overview of how Southern states are responding to weakened federal voting protections. - U.S. Department of Justice — Voting Section, Civil Rights Division
Federal enforcement updates and lawsuits related to voting discrimination and redistricting. - League of Women Voters — Voting Rights Litigation Updates
Summaries of ongoing litigation and advocacy campaigns to protect access to the ballot. - Heritage Foundation — Election Integrity Scorecard
Provides comparative data on election law restrictiveness and ballot access, offering a conservative counter-perspective.

October 4th, 2025