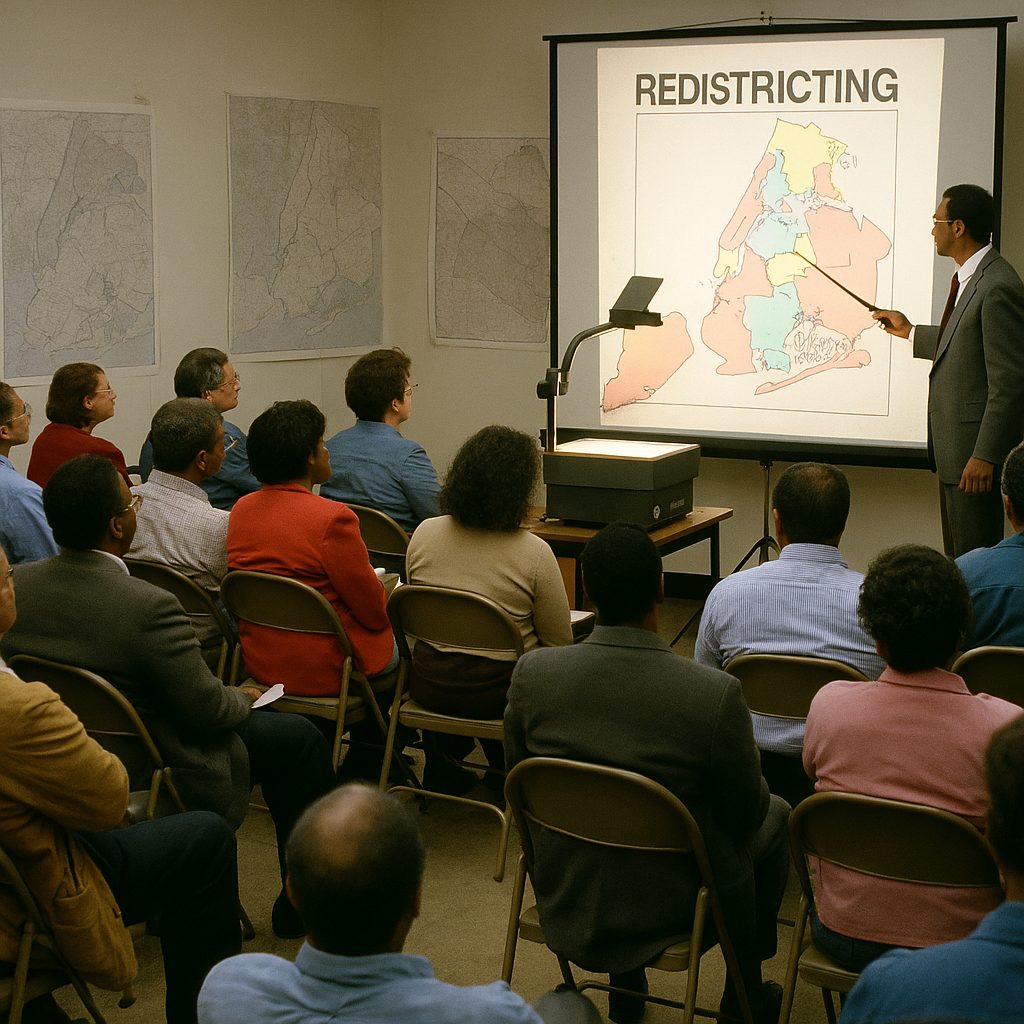
Take our Black electoral political power quiz to understand the ongoing struggle for African American electoral control...
Quiz
Explore interactive quizzes on Black political history, leadership, cultural movements, voter suppression, and community organizing. Test your knowledge and deepen your understanding of pivotal moments and institutions.

Brooklyn’s The East was a sovereign Black institution born in Brooklyn, New York, in 1969. It was...