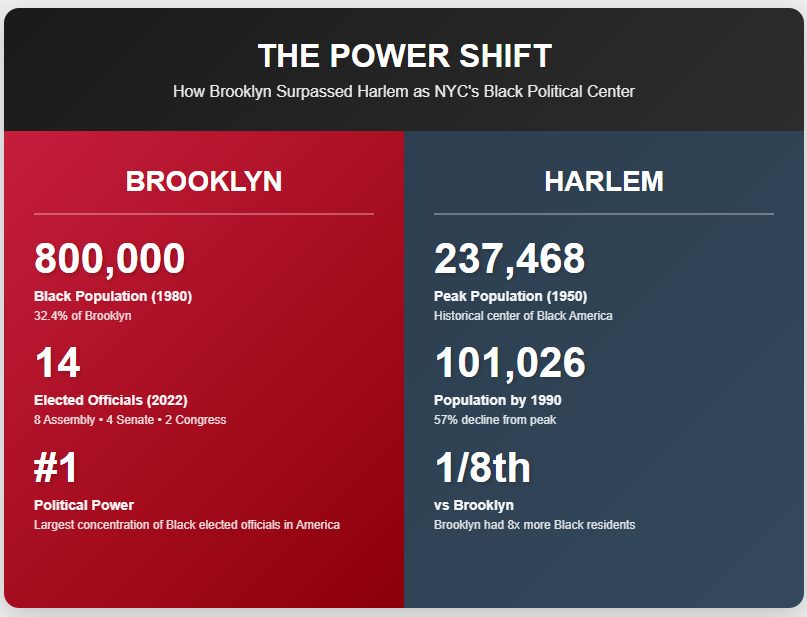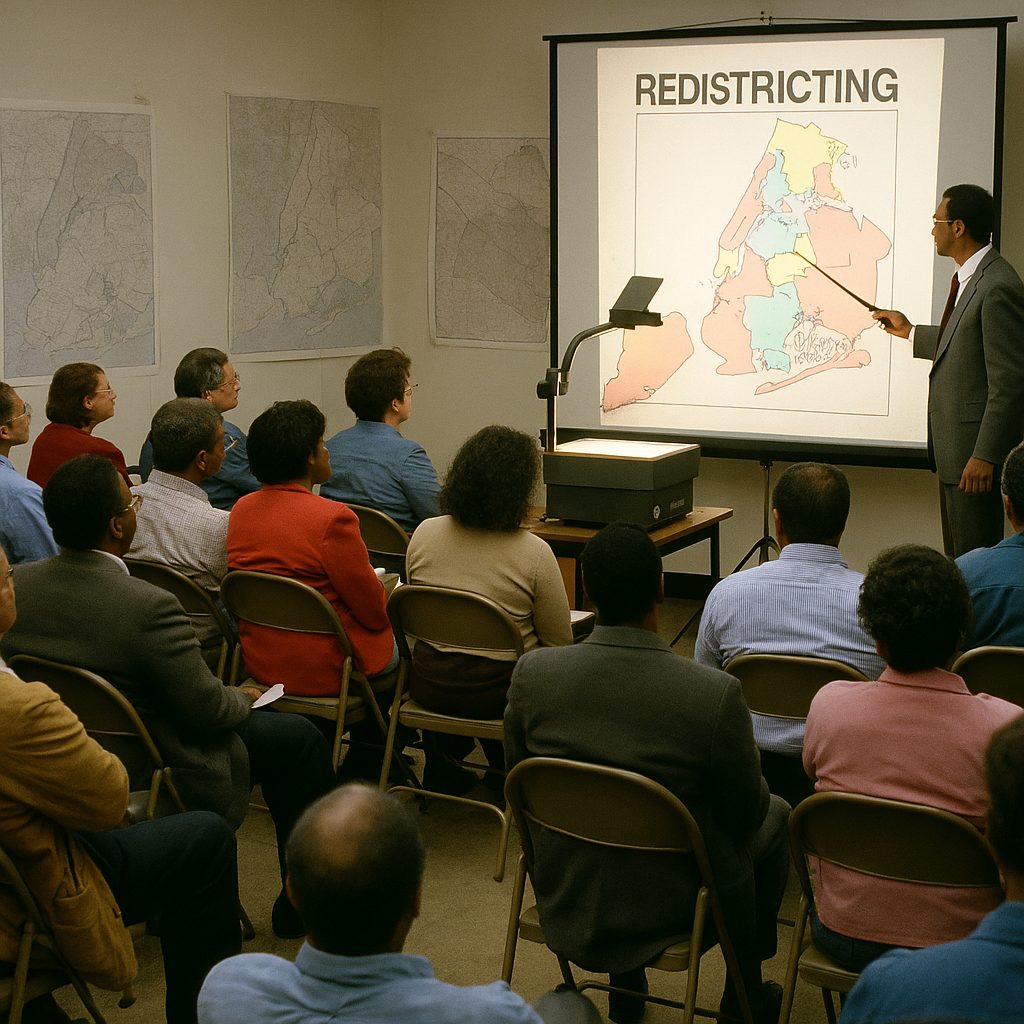
How the Community Service Society and the 1991 Redistricting Quietly Rewired New York City Politics I. Introduction:...
Voting Rights & Democracy Policy
Policy developments, legislation, and court decisions shaping access to the ballot, voting rights protections, redistricting, campaign finance, and the overall health of American democracy.

Take our voting rights movement quiz to test your knowledge of one of America’s most transformative struggles...
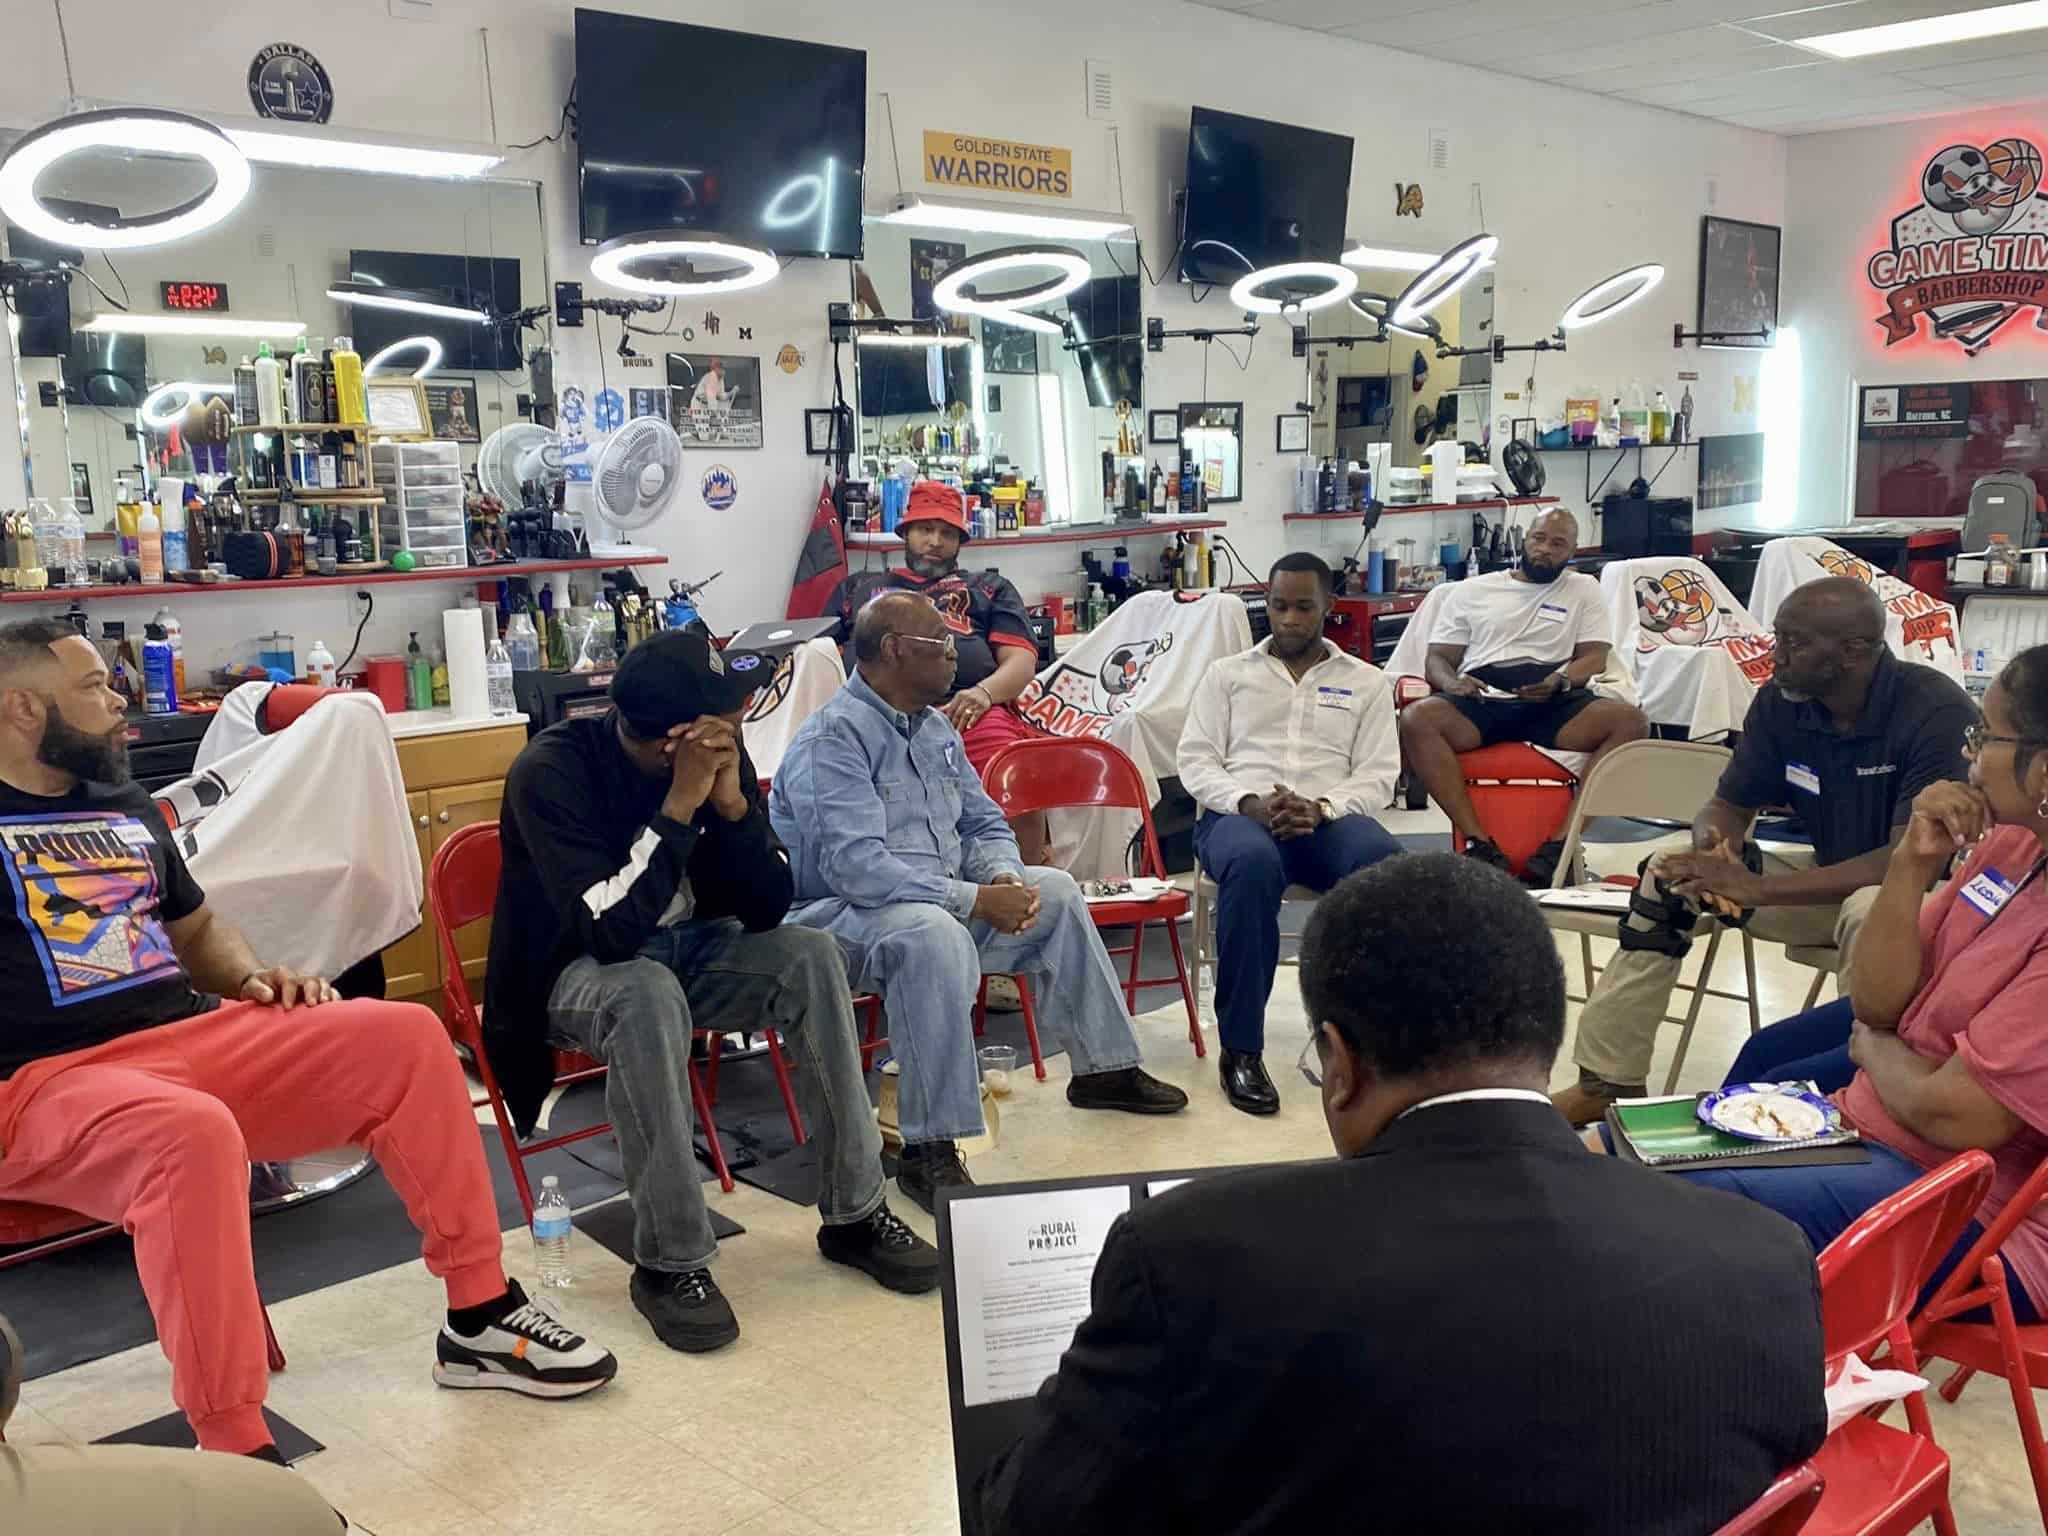
Why the Political Power of Black Rural Voters is Often Invisible Black rural voters in Wadesboro, North...

The Southern Regional Council and the Making of Black Political Power in the South The Southern Regional...

Fannie Lou Hamer and SNCC Two years before she ran for Congress, Fannie Lou Hamer did not...

In the Jim Crow South, activists became martyrs at the hands of white racists, all for the...

WASHINGTON, D.C. — Today, the U.S. Supreme Court issued an order to reargue the case of Louisiana...

ST. LANDRY PARISH, La. — Observing a joyous children’s holiday parade in the Louisiana parish she calls...

A woman casts her ballot at a polling station in Grand Rapids, Michigan, on November 3, 2024.Kamil...
Portrait of African American attorney Robert Morris. Courtesy of the Social Law Library, Boston, Massachusetts. That joy...