🏫 Uhuru Sasa Shule: The Freedom Now School of Black Sovereignty Uhuru Sasa Shule was the educational...
Education Opportunity Policy
Laws and reforms affecting K–12 schools, higher education, student debt, equitable learning access, and programs expanding opportunity.
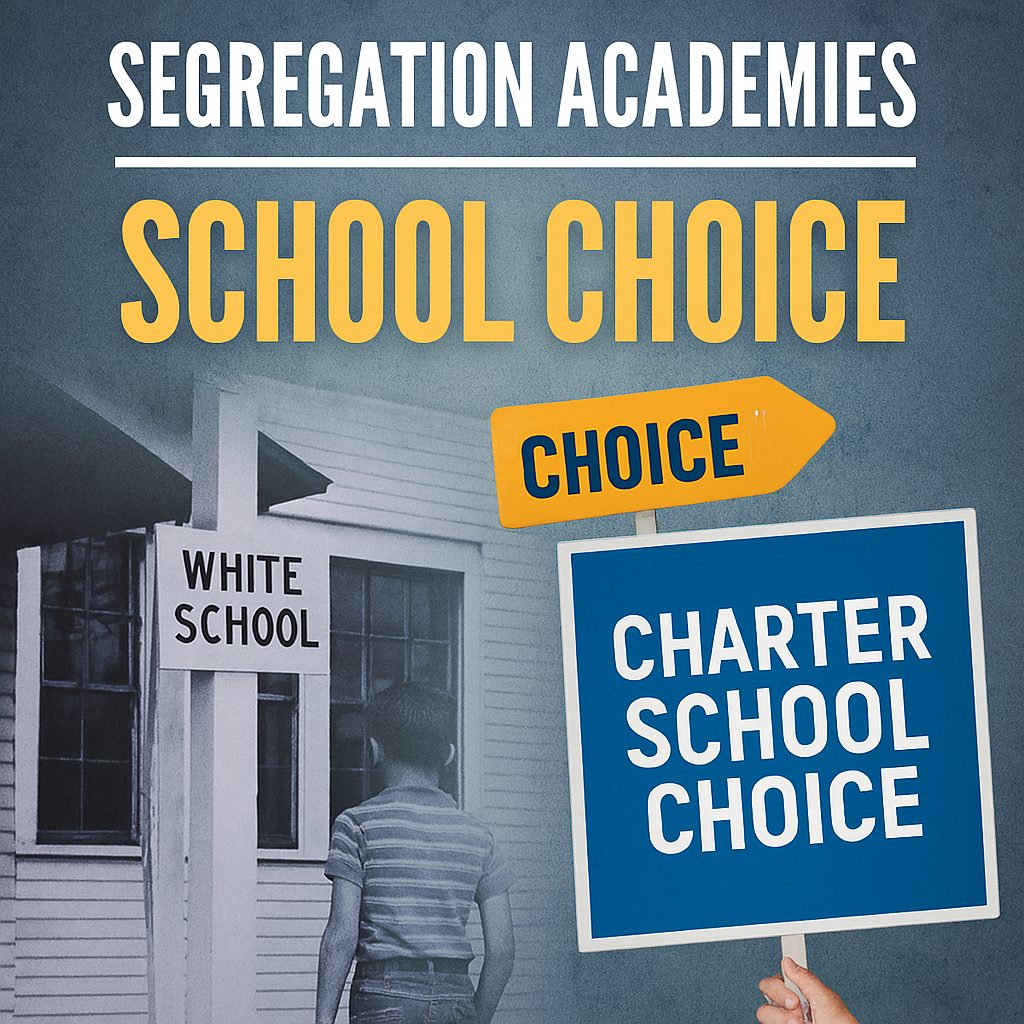
🏛️ Overturning Brown: The Segregationist Legacy of the Modern School Choice Movement ✍️ Introduction Steve Suitts’ “Overturning...
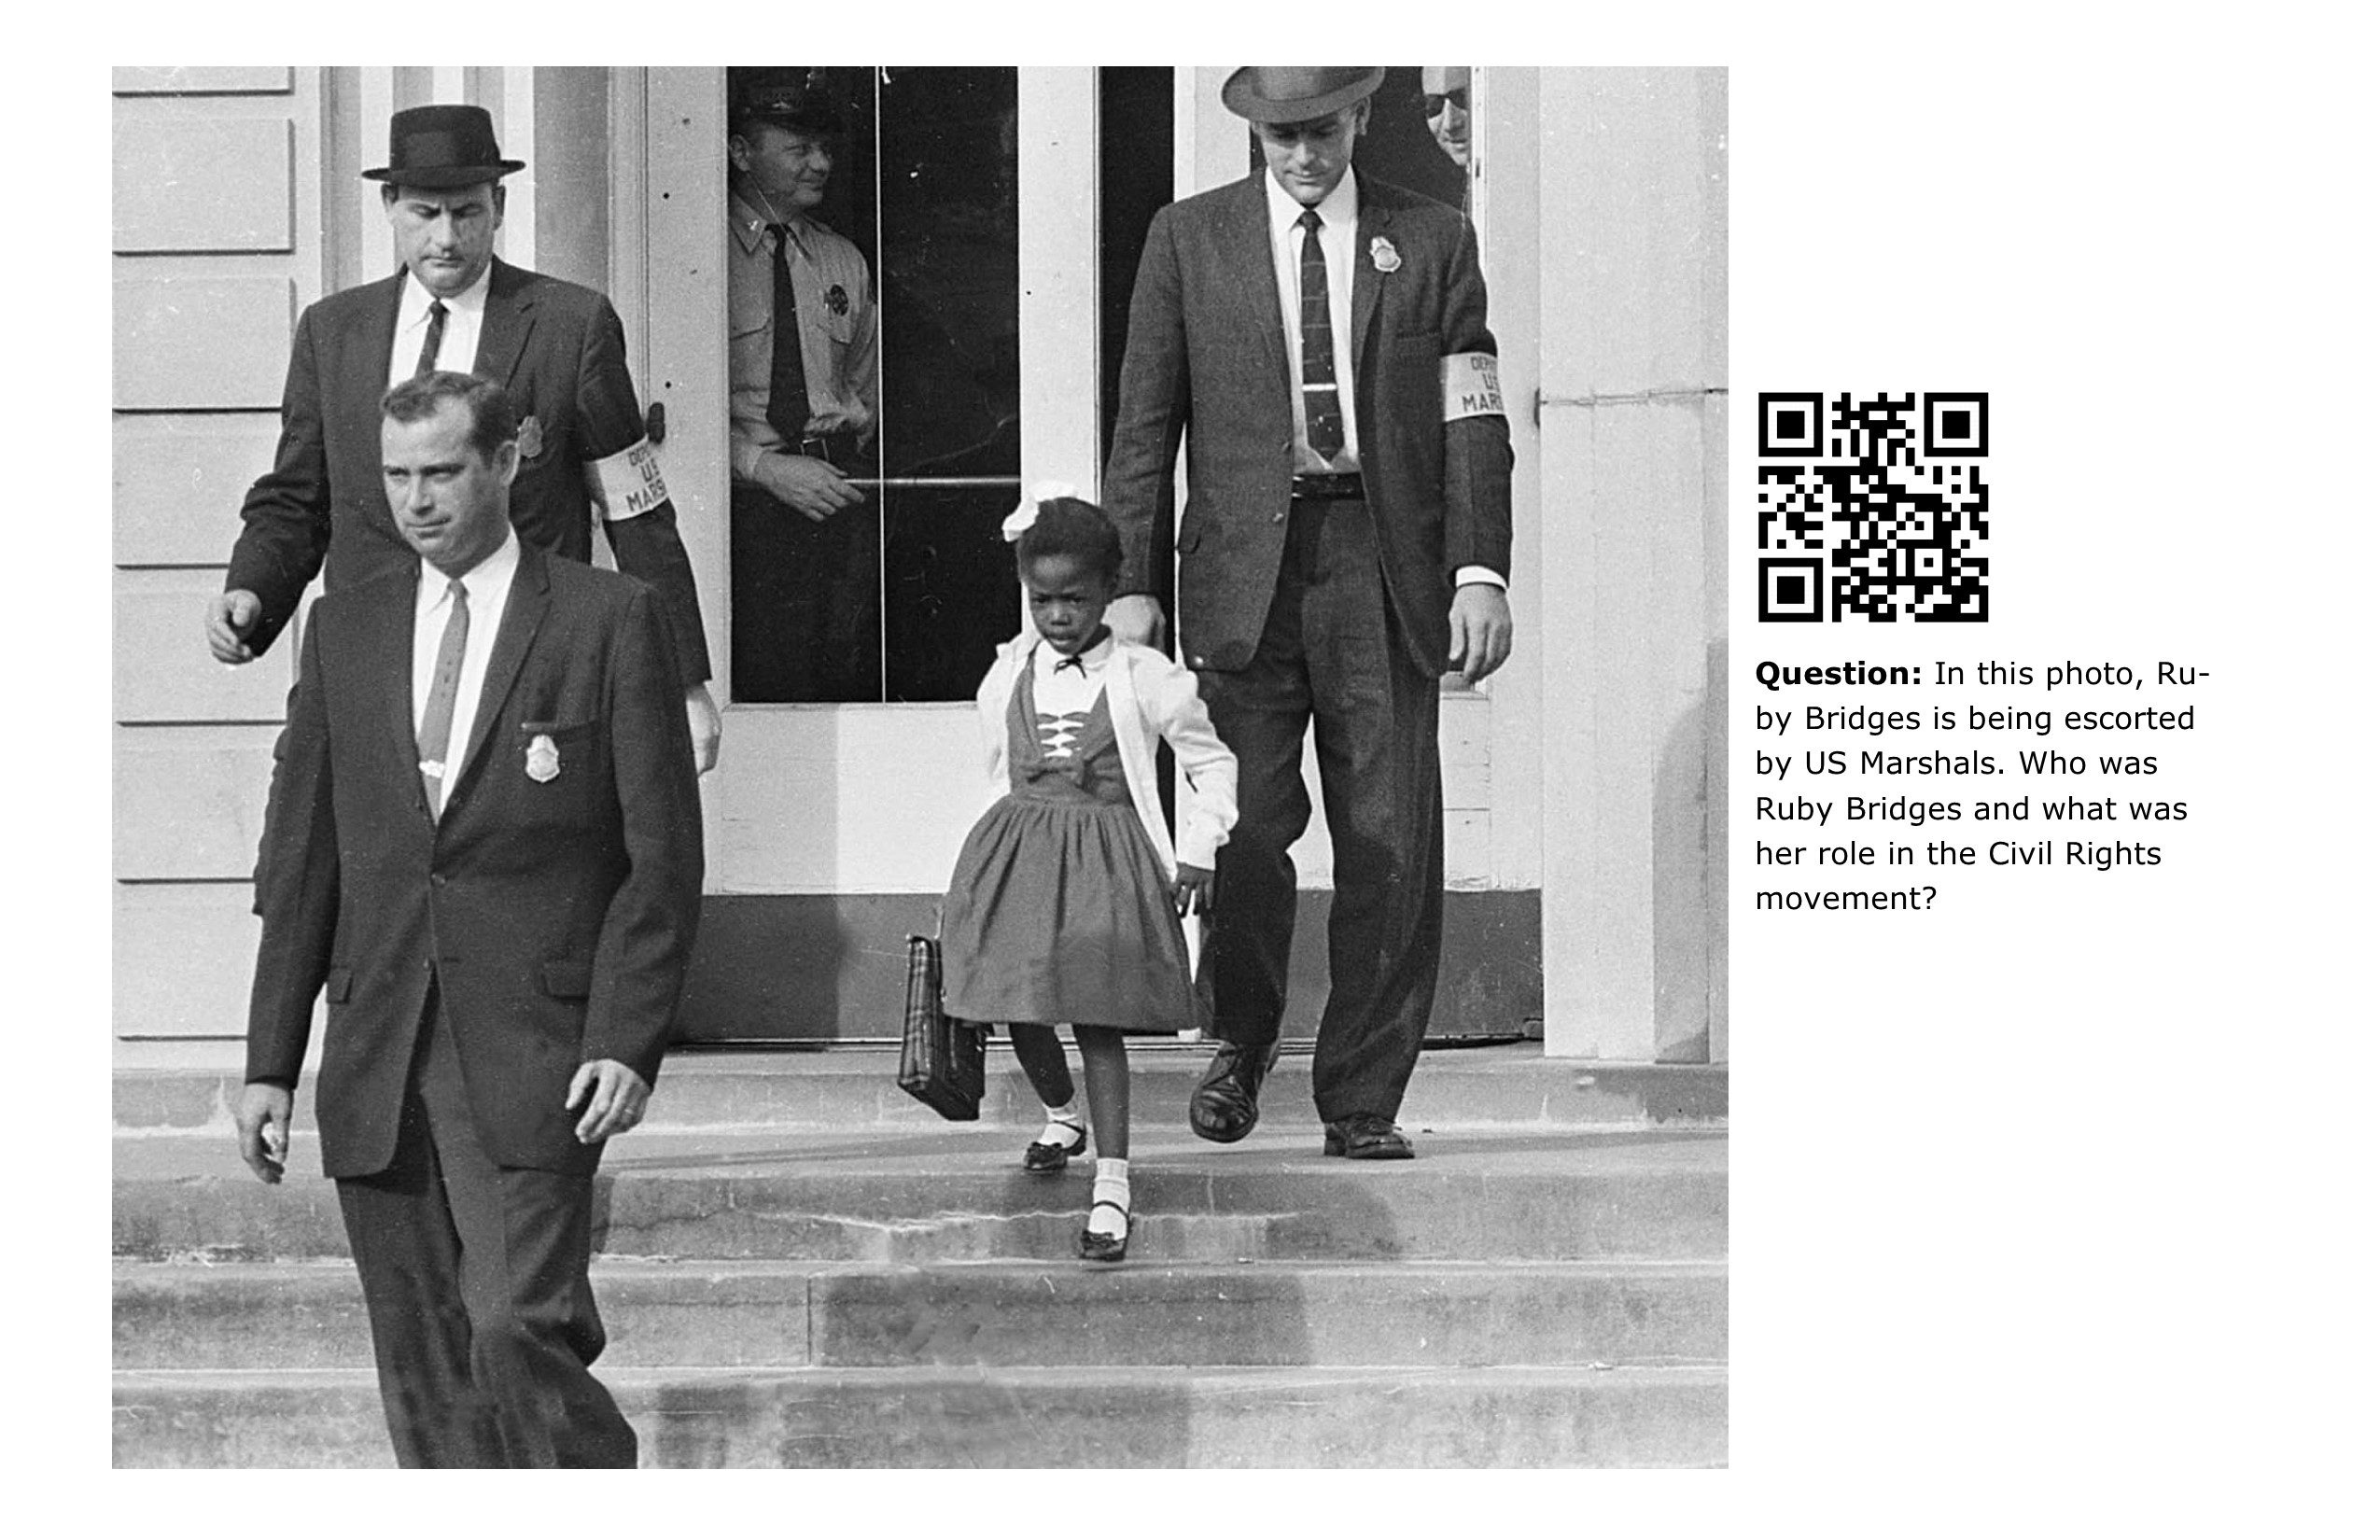
Ruby Bridges | Biography, Books, Accomplishments, & Facts Ruby Bridges (born September 8, 1954, Tylertown, Mississippi, U.S.)...