No organization defines the history of the African American struggle for freedom like the NAACP. The National...
Black Politics Newsroom
The Black Politics Newsroom curates timely, relevant, and mission-aligned content from trusted sources across the country. This editorial stream amplifies Black political discourse, tracks policy developments, and surfaces stories that shape our collective future. The original source for all curated articles is always listed at the end of each post, allowing readers to identify the original author and publication.
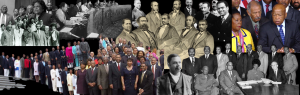
African Americans in Congress – Reconstruction to Present The emergence of today’s powerful Congressional Black Caucus has...
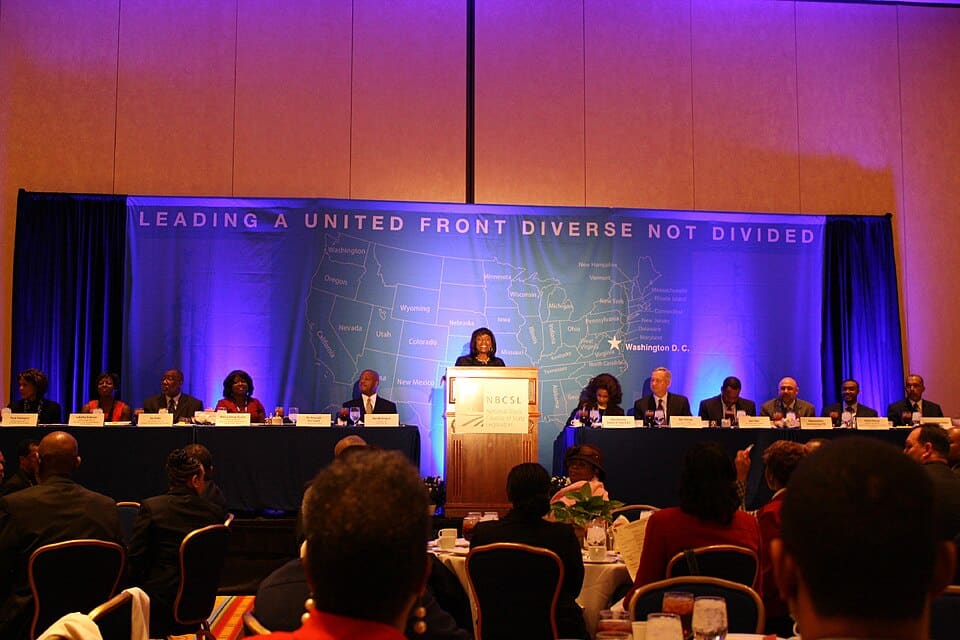
Black State Legislators from Reconstruction to the Present Legislative Black Caucuses The National Black Caucus of State...
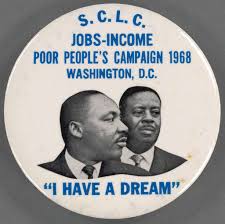
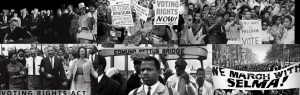
Southern Civil Rights Movement and Black Christian Church The Southern Civil Rights Movement of the 1960’s was...
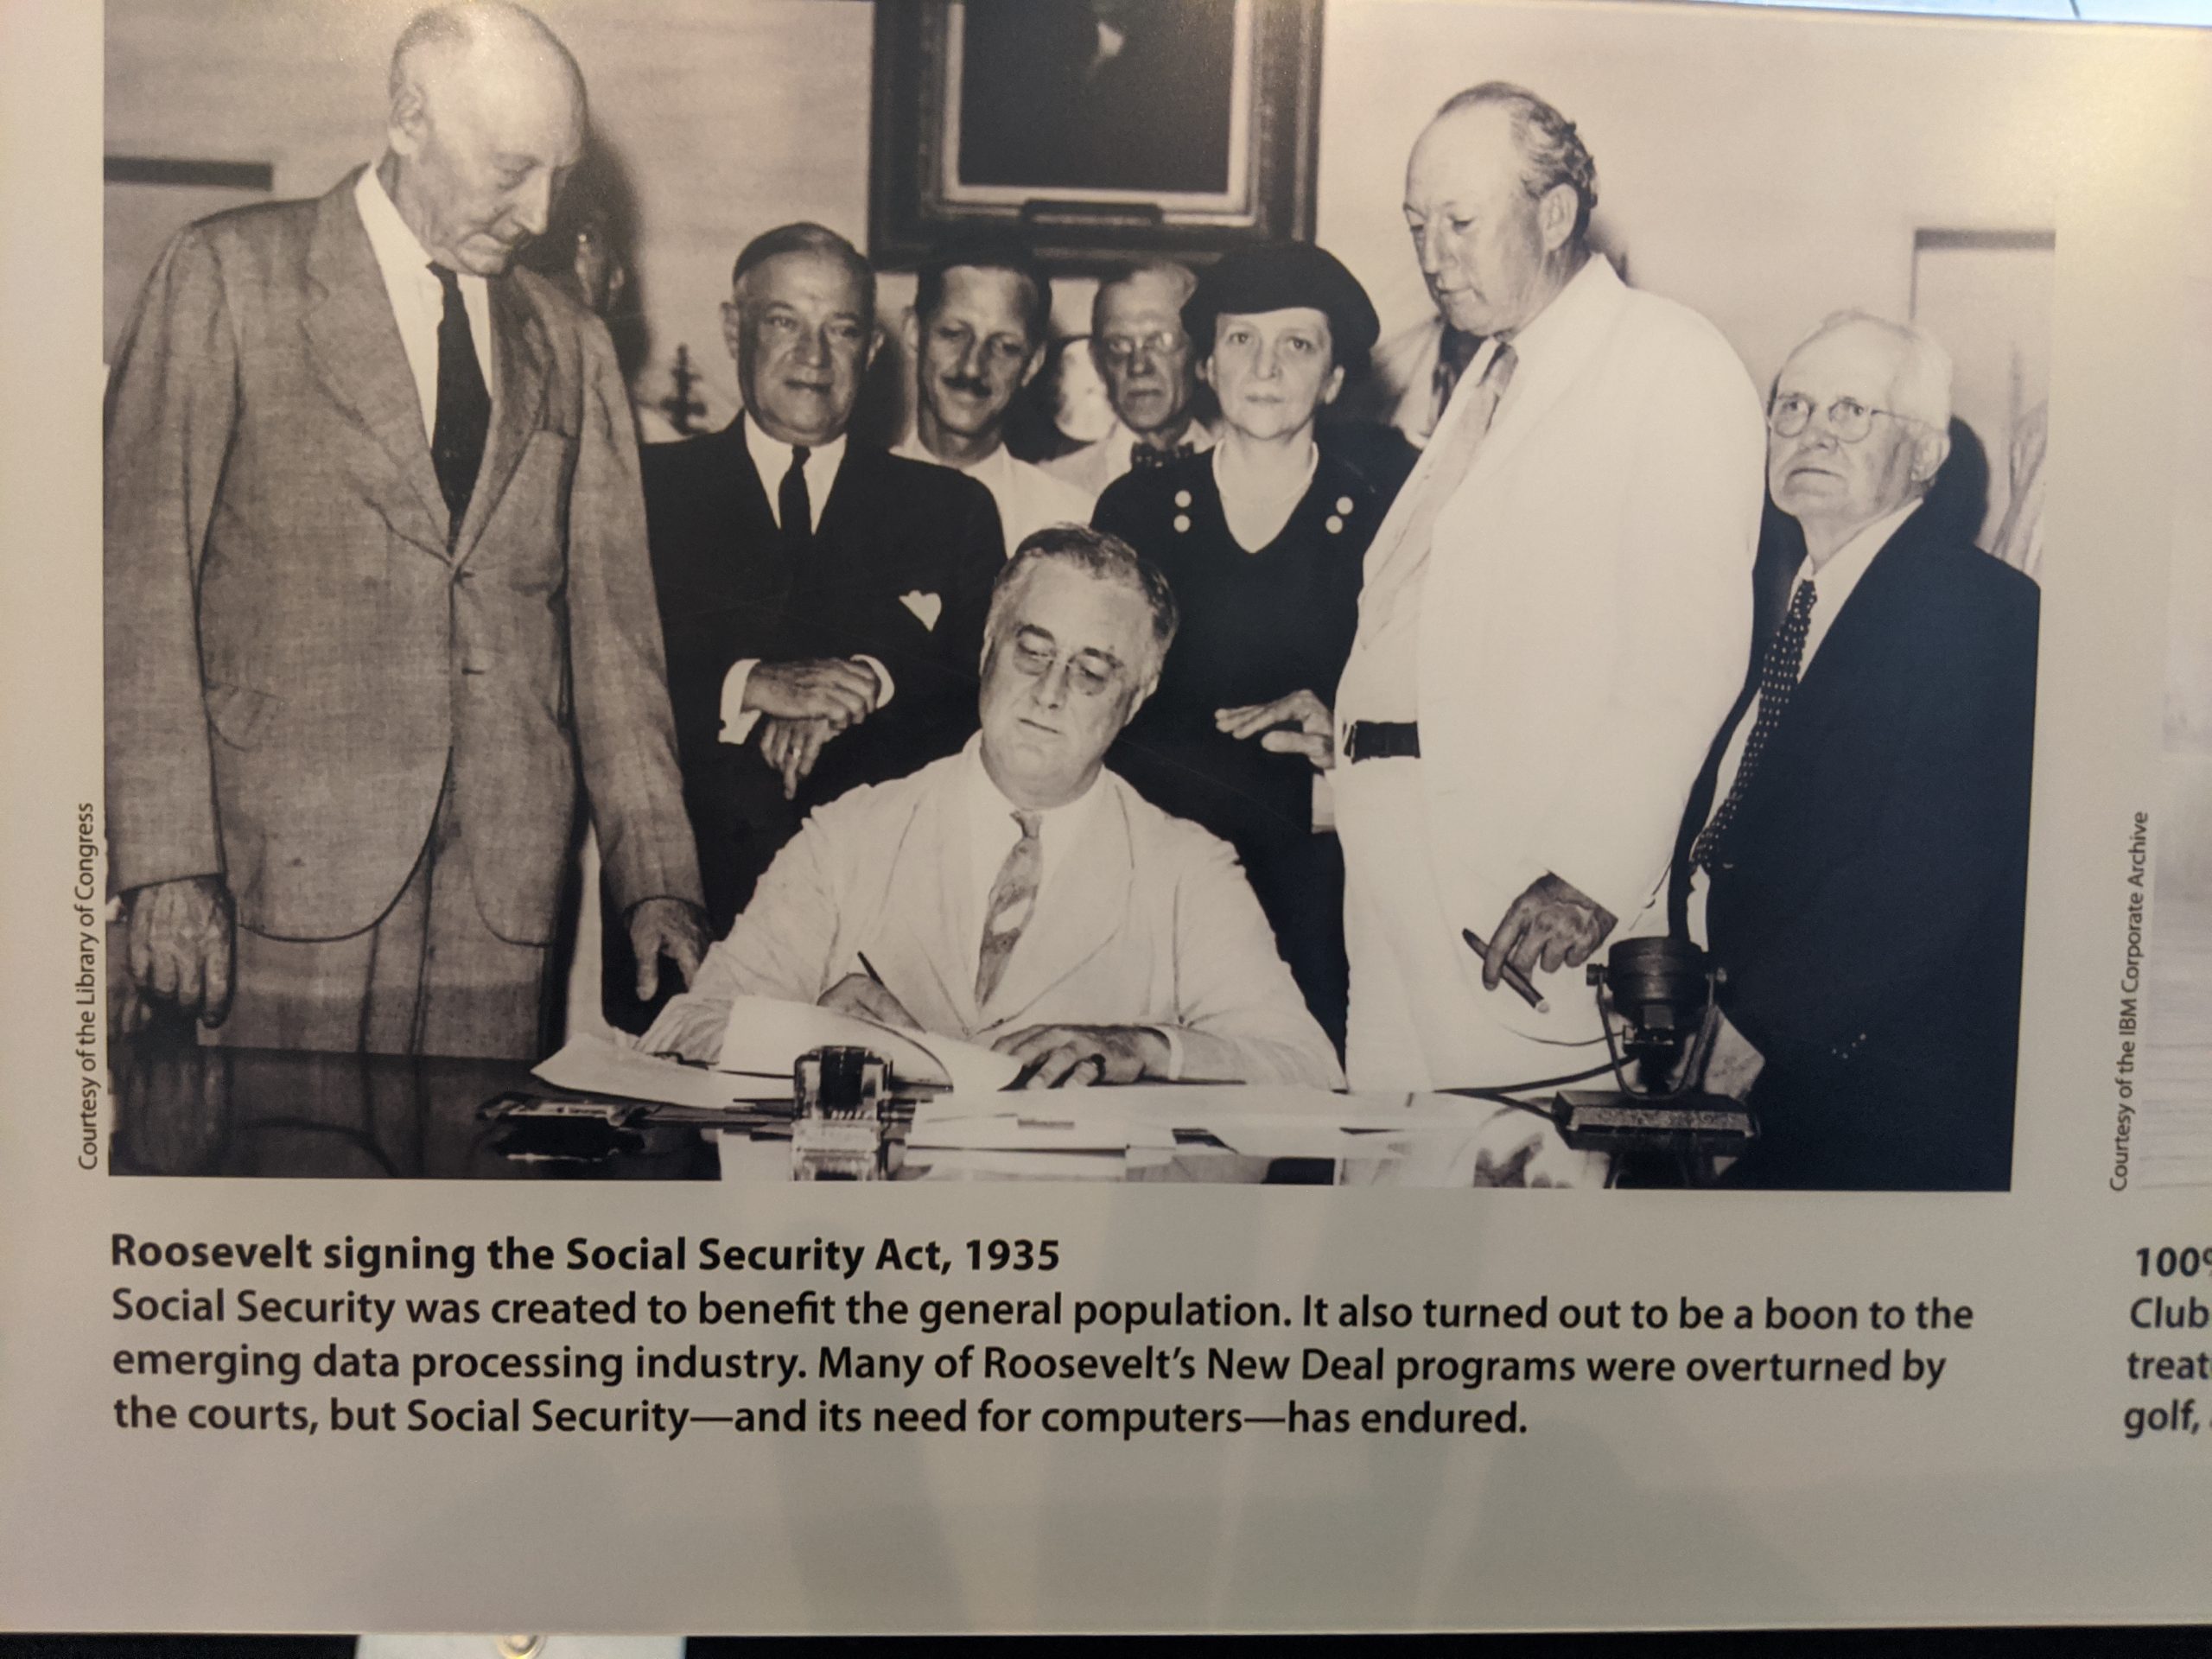
The New Deal The NEW DEAL for Blacks The New Deal was a series of economic programs...
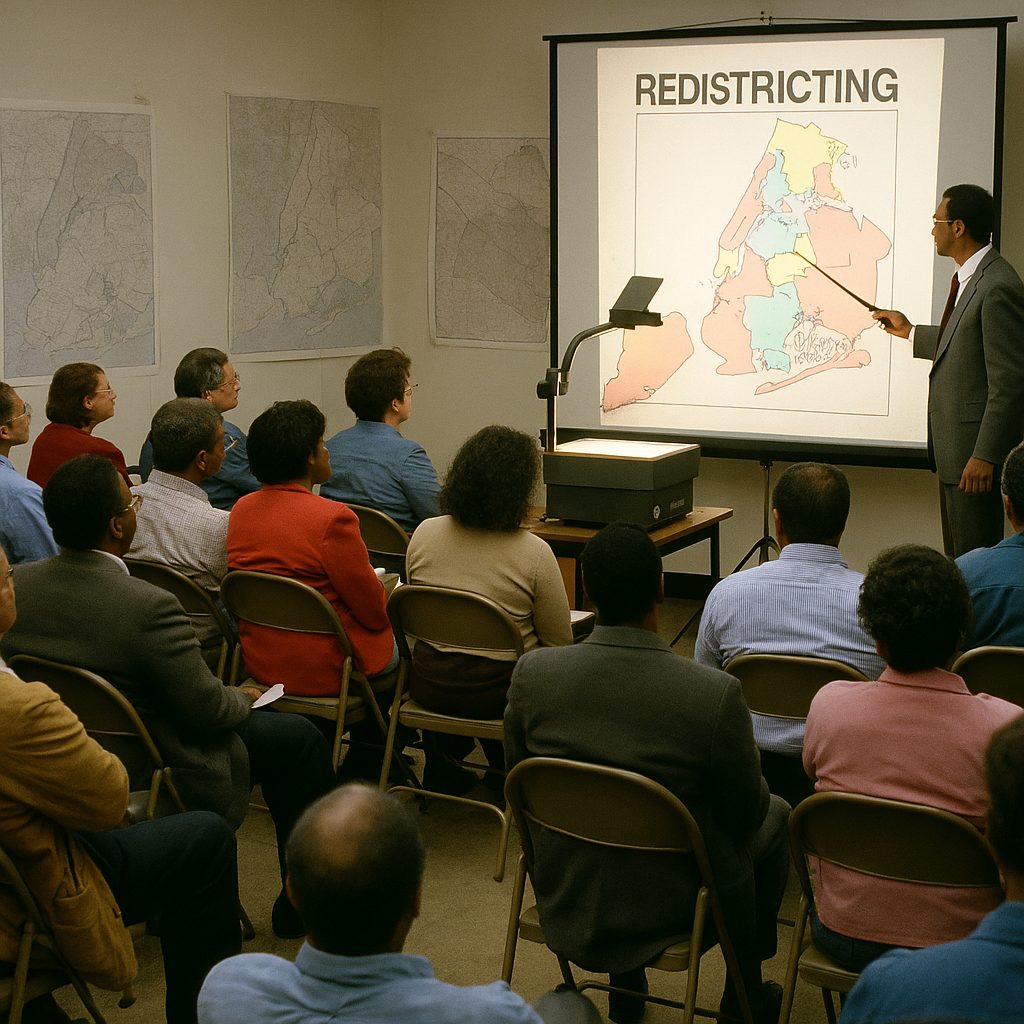
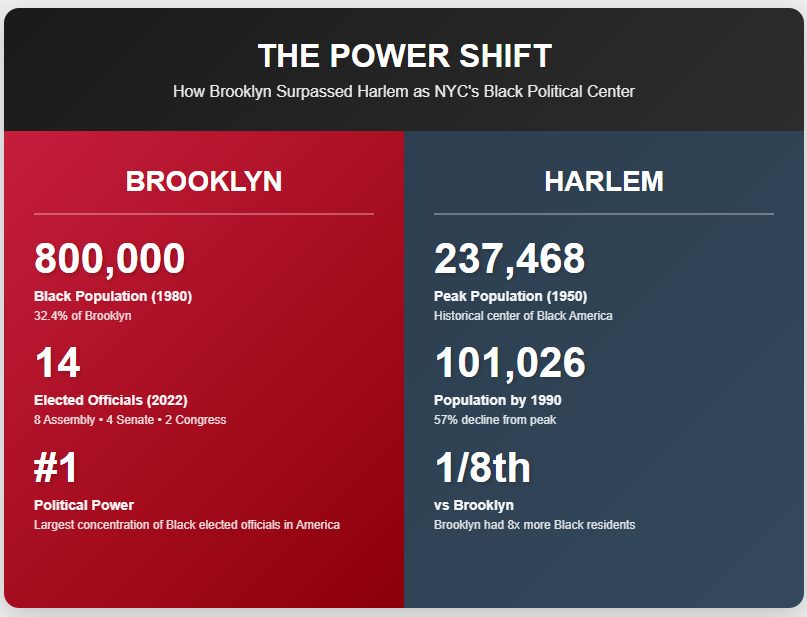
Single Member Districts and Black Office Holding The Modern Voting Rights Movement has transformed the United...
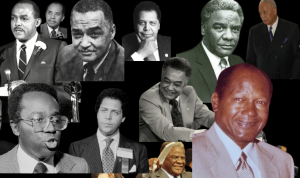
Richard Hatcher – Carl Stokes – First of the Black Mayors In the United States, the election...
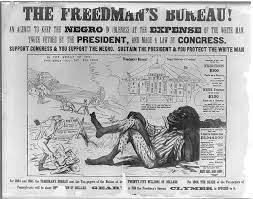
Reconstruction Era 1860 to 1880 In many respects, the Reconstruction period in American history was the most promising...